Bitcoin Cycle Score
Track Bitcoin’s cycle using seven on-chain, valuation, and momentum indicators combined into a single long-term buy/sell score.
66/100
Buy
Pulling toward buyRainbow chart, 4-year cycle
Pulling toward sellVWAP / Volume profile
BTC price · Live$77,454
Daily close03 Nov 2026
HorizonMonths to years
Signals7 indicators · −1 sell, +1 buy
Rainbow chart20%
18% of history below, fair value $144,990
+0.65
Puell multiple20%
0.99
+0.02
4-year cycle15%
day 928 since Apr 2024 halving
+0.64
Moving averages15%
price/200SMA 1.06, 50>200 SMA, 20<50 EMA
+0.45
RSI (14)10%
38.1
+0.60
MACD (12, 26, 9)10%
histogram -425, rising
+0.00
VWAP / Volume profile10%
90d VWAP $78,623, 1y POC $63,267
-0.46
From the maker

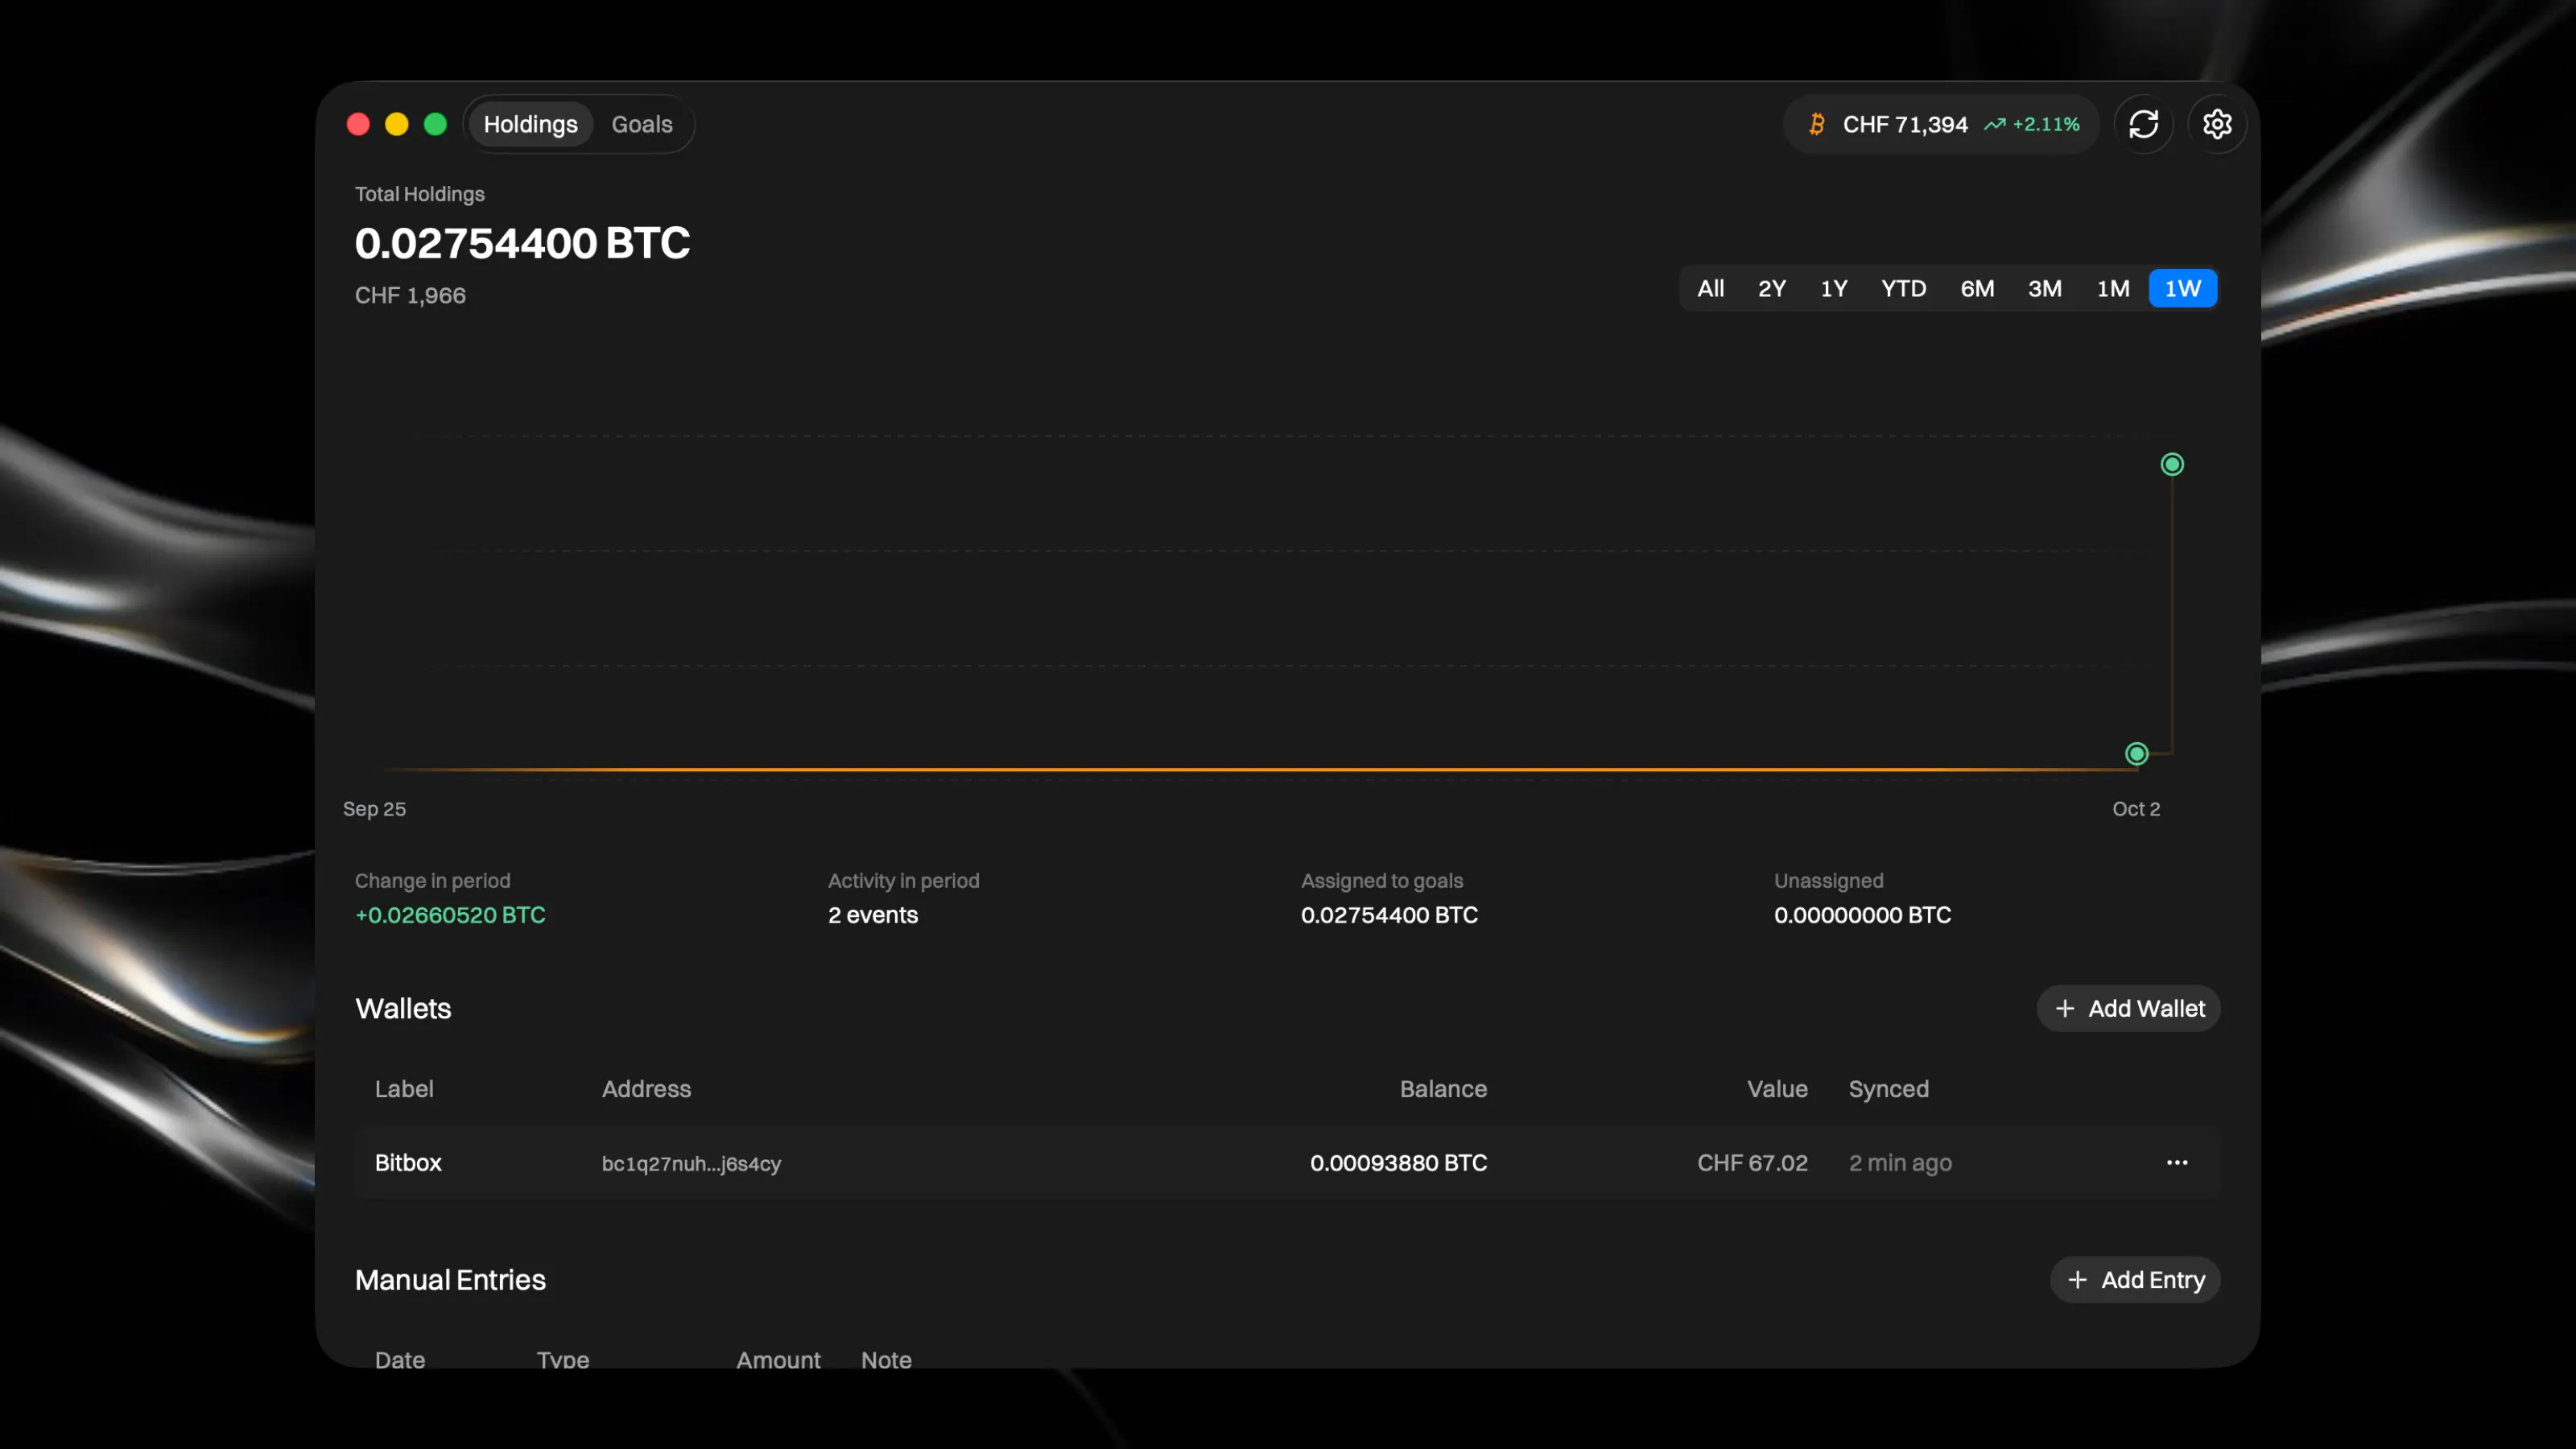
Stacker macOS
Track Bitcoin savings and goals
A Mac app for long-term savers. Log your Bitcoin, set savings goals and watch your stack grow over time.
Get Stacker for Mac